
GA4: The benefits, differences, and misconceptions
![]()
7 min read
5th April, 2023
![]() Written by Jordan Katherine-Sharp
Written by Jordan Katherine-Sharp
6 min read - 19th April, 2023

The key to success in any Search campaign is having accurate analysis. If you’ve recently transitioned from Universal Analytics to the updated Google Analytics 4, you’ll want to get the most out of the new features in GA4 Reports, whilst keeping track of your favourite metrics from UA.
How to get the most out of the new GA4 reports:
GA4 was built with customisable reporting in mind, but you still have several pre-built report templates available for quick access to key metrics. The reports in GA4 are found in the aptly named Reports section, found in the tab on the left-hand side of your Realtime report page.
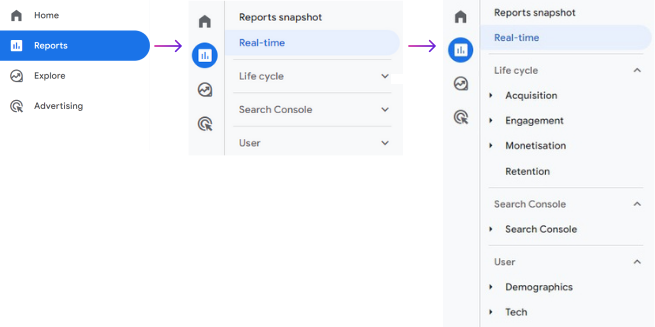
Your reports are split into two main categories:
Beyond these very top-line metrics are countless opportunities to really dig deep into your data, with several report types available.
Explore and Advertising
In addition to the reporting section - with the types of reports you’ll be more familiar with if you’ve used UA - are now two new sections:
We know how important details are in tracking small changes to campaigns that have the potential to create a big impact for our clients. The report types in GA4 are worth understanding to get the most out of your campaigns. We’ll stick mainly to the reports section and touch on a couple from Explore and Advertising.
Here’s what you can discover with report type:
Understanding where your users start their journey to your app, site or store is vital. In Acquisition Reports you’ll find new templates, like User Acquisition: First User Medium.
This is a new feature in GA4 that we didn’t have access to in UA. It shows you the traffic medium used to find your site, like email, organic search or Paid Search ad clicks.
Armed with this knowledge, you’ll be able to better plan your customer acquisition campaigns. We think you’ll find it very useful in developing your understanding of your prospective customers.
This is where you can find out more about what users do once they find your site- like the success rate of your most personalised metrics.
Engagement Reports brings both app and website pages together into the reporting section Pages and Screens, which you can find in the Engagement section. This is also where you’ll find your Events. (Events are a new element of GA4 and are used to track all sorts of specific metrics in your campaigns).
This is extremely useful data to have to hand, helping you discover the stand-out pages on your site and pull the focus away from less engaging pages.
Surely the most exciting part of any campaign is getting to share the success of increased conversions with your client. This is in the Engagement section as well. You’ll find data on the conversions and be able to drill down into the details of how, where and when those conversions took place.
Once again, these conversions are more developed in GA4 compared to UA. This is because you can make any event a conversion in GA4, allowing you to track them within Conversion Reports.
Once they're tracking, you can see the campaigns, locations, devices and channels that are bringing you the most success.
The monetisation section now includes metrics that honestly we don’t know how we survived without in UA, like in-app sales and revenue for subscription upgrades.
Something that really excites us is the new Predictive Insights option in ecommerce reporting. Using percentiles of probability, potential outcomes are predicted in GA4, pairing Google’s machine-learning capabilities with the data from your campaigns! Use your best judgement here; though these are just predictions.
When partnered with your own analysis and campaign forecasting, Predictive Insights could be a very powerful option. Monetisation reports are especially useful for campaigns attached to large ecommerce stores. You can find all the relevant metrics to analyse the attribution, user journey and demographics of your ecommerce campaigns.
The Cross-channel Reports allow you to track user journeys to goal completion or ecommerce transitions, through multiple touchpoints. (These templates are slightly hidden, in the conversion paths and model comparison tabs, under the Advertise section.)

This is a real breakthrough in Search reporting. Organic search, display ads, paid search ads, emails and direct interactions are all accounted for here.
Simply put, it’s rarely just one interaction that results in a conversion, so it’s worth seeing how a user interacted with your site across multiple touchpoints to get a more realistic idea of their behaviour.
You may be familiar with segments from using UA. In GA4 they still exist and you can use the Explore section to create segments. In addition to this, under Variables, you can choose from a specific date range, dimension, segment or metric to pull out only the most relevant data.
UA only has user and session based segments, whereas GA4 now has three types of segments - user, sessions and events - and you can compare them to each other. For example, you could analyse the difference between users who have previously purchased from you to users who have not made a purchase before.
Having this additional data makes the reports more dynamic and provides some great opportunities to understand your data in a way that is hyper-specific to your campaigns.
Adding these elements to your reports will give you a granular understanding of your campaigns that may shed light on where that ad spend is best put to use.
While the report categories above do provide some key insight, more personalised and specific analysis is often needed to get the most out of your data. It’s time to get specific and focused with your reporting. Here’s how you do it:
First, select either Free Form or Blank under Explore from the sidebar on the left. This will create either a sample report or a completely blank page to build your report on.
You should now have a better understanding of what GA4 reports can offer. From new features to tried and tested metric reporting carried over from UA. You’re now ready to put your data to use and reap the benefits of GA4’s improved reporting options.
If you’re looking for expert management of your account, get in touch with us to see how our specialist Search Account Managers can provide the best solutions for your GA4 account.


