
GA4: The benefits, differences, and misconceptions
![]()
7 min read
5th April, 2023
![]() Written by Jordan Katherine-Sharp
Written by Jordan Katherine-Sharp
8 min read - 12th July, 2023

You’ve made the transition to GA4, your account is set up properly and you’re gathering data. Are you struggling to find and build the reports you need though? If you missed our webinar, this article neatly summarises our advice on how to use GA4 Reports to improve performance.
We’ll cover:
Firstly, let’s look at the differences in the terminology and what’s being reported differently for some of the key traffic metrics - users, page views, sessions, bounce rate, and of course, conversions.
Thankfully not much has changed here as it's all based on event data.
We’ve seen the introduction of a new metric called Active Users which didn't exist in UA. These are users who’ve had an engaged session (more on that later) that are triggered by specific events like first_visit or first_open.
In terms of page views, you need to remember we can now include our app traffic if that’s applicable.
Unique Page views have gone away as a standard metric, however, there is a workaround for this, by creating a custom event to capture unique page views using Tag Manager, so you’ll need some basic coding skills for this.
Top tip: We’d advise is that you switch the way you think about your data, rather than getting GA4 to fit what you’ve always done.
Sessions in both UA and GA4 are counted up until there is a period of 30 minutes of inactivity.
However, in UA there were other ways for them to end. In GA4 it’s simplified to just the 30-minute window.
What’s really different is the way the data is gathered, which we went over in our previous webinar on transitioning to GA4, so if you want to find out more about that you can have a look.
Basically, in GA4 a session starts once the session_start event is triggered and a session ID is then generated.
But you can calculate this or set up your own report.
A basic calculation is [all sessions] minus [engaged sessions] to get the total number of non-engaged sessions. Then [non-engaged sessions] divided by [all sessions] to get % of non-engaged sessions and what we previously referred to as a bounce rate.
GA4 is focused on engagement and activity
When we think about it, the bounce rate is exactly the opposite - based on inactivity on a page. So, it doesn’t make much sense in the world of GA4 to measure this, instead, they’re focusing on engaged sessions vs. non-engaged sessions.
The main difference here is:
Top tip: To reduce conversion count differences between your UA property and corresponding GA4 property, update your GA4 conversion counting method setting to once per session.
This one isn’t strictly a report but it’s by far one of the best features in GA4 (in our opinion). For example, if you’re struggling to find what you need, just type it in and GA4 will throw up a report for you. Simple as that.
From the main overview screen, you can access pre-set reports on traffic acquisition channels, as well as new users and organic traffic etc. That covers the basics that you’ve probably been tracking in UA.
What do the reports include?
These reports include users, sessions, and engaged sessions. There’s the new engagement rate (calculated using other engagement metrics like engaged sessions per user) which is the more positive cousin of bounce rate as previously mentioned. Conversion and revenue can be found here too. The channels are grouped by default and you can easily add additional filters.
Top tip: Rather than focus on how many you lost, look at how many engaged sessions you gained.
From the standard landing pages report in GA4, you’ll be able to see the top pages people have viewed, where the traffic came from, engagement, conversions, and revenue metrics. Really useful no matter the channel to see how performance is doing.
Where UA had dashboards, GA4 now has Explorations. These are far more advanced and flexible than dashboards so investing time in setting them up is worth it, in our opinion. You can either start from scratch using a blank exploration or use a pre-set one.
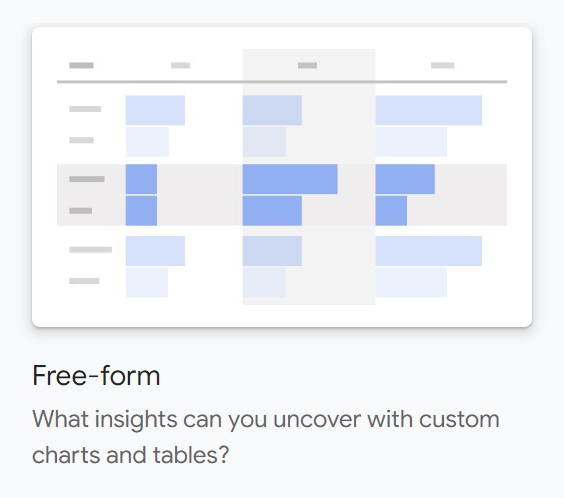
What are free-form explorations?
It requires a bit of tinkering around to work out how to create what you need to. They're essentially custom charts and tables.
How do free-form explorations work?
Much like UA though, it uses dimension and metrics, also segments if you need them. Simply click add and then scroll to find what you want to search for at the top. Then choose the visualisation - chart, graph, etc and the number of rows and columns you’d like to see. This is where you could set up a bounce rate report - if you really want to.
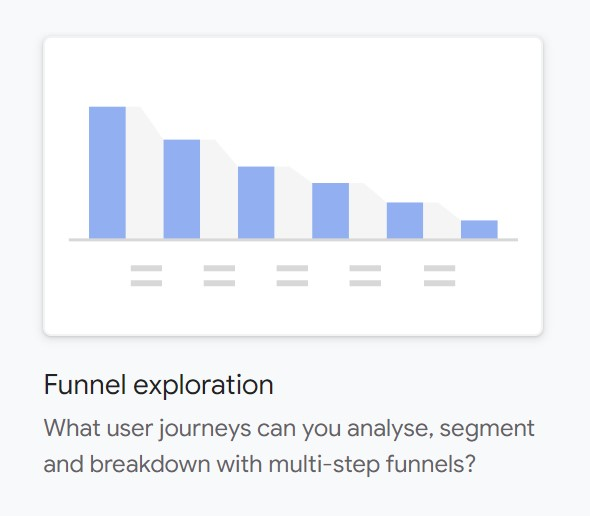
What are funnel explorations?
These help you to map out user journeys so you can analyse, segment, and break down the data with multi-step funnels.
How do funnel explorations work?
You can visualise the steps users take to complete tasks (for example a conversion event) on your site or app. From there you can identify ways to optimise the user experience as well as over or under-performing audiences.
For a funnel exploration, you can use the template for this to get you started and delete or add dimensions as you need, so it's a bit more user-friendly.
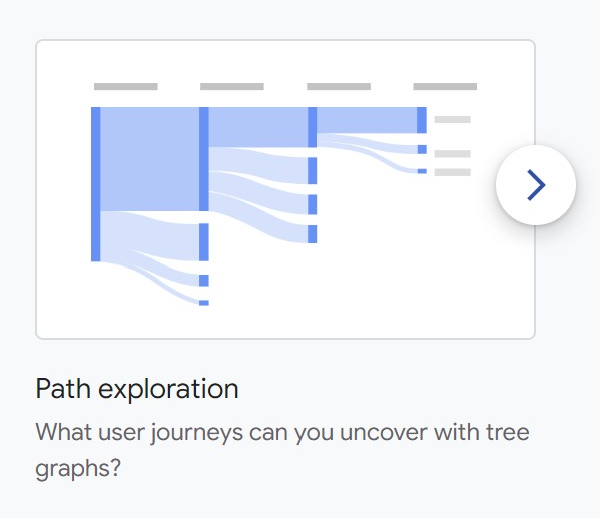
What are path explorations?
Path explorations help you to visualise the paths your users take as they interact with your website and app. These tree graphs can help you to uncover user journeys.
How do path explorations work?
For example, you can:
This might sound similar to the funnel analysis, but ultimately the two go hand in hand. The main benefit from this report is identifying where visitors might be failing and you can make informed decisions to rectify or adapt your site or app to support their journey.
Need more information on using GA4 Explore
Being able to create events directly in the interface wasn’t possible in UA so this is an exciting development. And far simpler than doing it in GTM.
Why would you want to track additional conversion events?
Things like 'newsletter sign ups' can be added as a conversion event. Ultimately, you need to track things that are important to client acquisition and engagement as a whole, not just at the bottom of the funnel, but throughout a user journey.
Imagine you're running a broad keyword campaign in Google Ads, and someone who has never heard of you comes onto your site, has a look around, signs up to a newsletter so they can learn more about you and then leaves that session.
Without tracking that interaction you’d have seen that click and user visit as a fail if they didn't buy or fill in a form there and then.
You now have the ability to create events that track user interactions with your site that align with your specific business objectives. And, because GA4 is event-based, every single interaction is an event, so in theory, any of them can be turned into a conversion (these used to be called goals in UA).
Before you create or modify an event:
Make sure the name of the custom event is not a reserved name.
You can create up to 50 events based on existing events. Navigate to the admin area and then select events. You can then create a new event and configure it from there.
GA4 only automatically marks 5 events as conversions, so you’ll need to set up your own.
You can set up a conversion in the admin area. You can mark up to 30 more (50 for Google Analytics 360) app or web events as conversions. You can get more specific than that and set up conversions only to count based on certain criteria being met but let’s save that for another day.
Equally, you may want some events to be marked as conversions, that aren’t already set up that way. Simply toggle the ‘mark as conversion’ button in the Events screen under admin.
The Events report shows you a count of how many times each of your tracked events is triggered and many users trigger each event on your website or app.
By analysing the events users trigger on your website or app, you can make improvements to the user experience and increase conversions. These will have been set up in Admin > Events. Some may be set up for you - like first_visit, page_view, and session_start.
This might be an obvious one. You’ll need to have marked the events you want tracking as conversions in the admin area for this to show what you need it to show.
The Conversions report shows you which conversion actions are most common, how many users performed each action, and how much revenue is associated
Top tip: Test it using the real-time report to check data is being captured.
Make sure you test it using the real-time report to see if the data is being captured correctly when setting up events. A necessary evil to make sure it's tracking perfectly.
Embrace engagement metrics rather than lack of engagement (i.e. bounce rate).
Think more positively. Making that switch in mindset might be tricky but worthwhile.
Get your head around events and the benefits of an event-based system.
Use natural language search to your advantage.
Quick questions to get top-line numbers are such a time saver.
Set up custom reports for more detailed data that you need regularly.
Set up events and conversions that fit with your business objectives.
It's a great time to really think about what's important and what's worth recording.
Need more information on using GA4 Reports or on the benefits of GA4.
Q: I work within an ecommerce team. We feel like we're sending more data to GA4 than before but getting fewer reports out of it. Is this normal, or have we perhaps set something up incorrectly?
It might be that it's all set up correctly, however despite this GA4 is not set up to display all of the data. It comes back to setting up custom reports to make sure you're seeing what you need to see.
Q: With the new approach to events, I miss the 'category', 'action', and 'event' grouping/drill down we used to have. Is there any way to get this back?
Frustratingly no. Google has pulled some of these features as standard. Categories you can pull into a custom report and the grouping and drill down are elements you'll need to build out yourself. Please note that some of the parameter names have changed, for example, product ID has changed to item ID.
We feel the key to getting the most out of GA4 Reports is to dig deeper than the standard reports available there. GA4 isn’t an out-of-the-box solution like UA, it’s designed to be set up with bespoke reports specifically for your business and your goals. The time you’ll need to take to set them up will save you hours in the long run. And no more trying to make reports fit what you need with multiple manual filters.
If you need more help with GA4 reports, please get in touch. We’d happily talk about it all day.


